- Home >
- Services >
- Access to Knowledge >
- Trend Monitor >
- Source of threat >
- Trend snippet: The distribution of security jobs mirrors the distribution of economic activity in the Netherlands
Trends in Security Information
The HSD Trendmonitor is designed to provide access to relevant content on various subjects in the safety and security domain, to identify relevant developments and to connect knowledge and organisations. The safety and security domain encompasses a vast number of subjects. Four relevant taxonomies (type of threat or opportunity, victim, source of threat and domain of application) have been constructed in order to visualize all of these subjects. The taxonomies and related category descriptions have been carefully composed according to other taxonomies, European and international standards and our own expertise.
In order to identify safety and security related trends, relevant reports and HSD news articles are continuously scanned, analysed and classified by hand according to the four taxonomies. This results in a wide array of observations, which we call ‘Trend Snippets’. Multiple Trend Snippets combined can provide insights into safety and security trends. The size of the circles shows the relative weight of the topic, the filters can be used to further select the most relevant content for you. If you have an addition, question or remark, drop us a line at info@securitydelta.nl.
visible on larger screens only
Please expand your browser window.
Or enjoy this interactive application on your desktop or laptop.
The distribution of security jobs mirrors the distribution of economic activity in the Netherlands
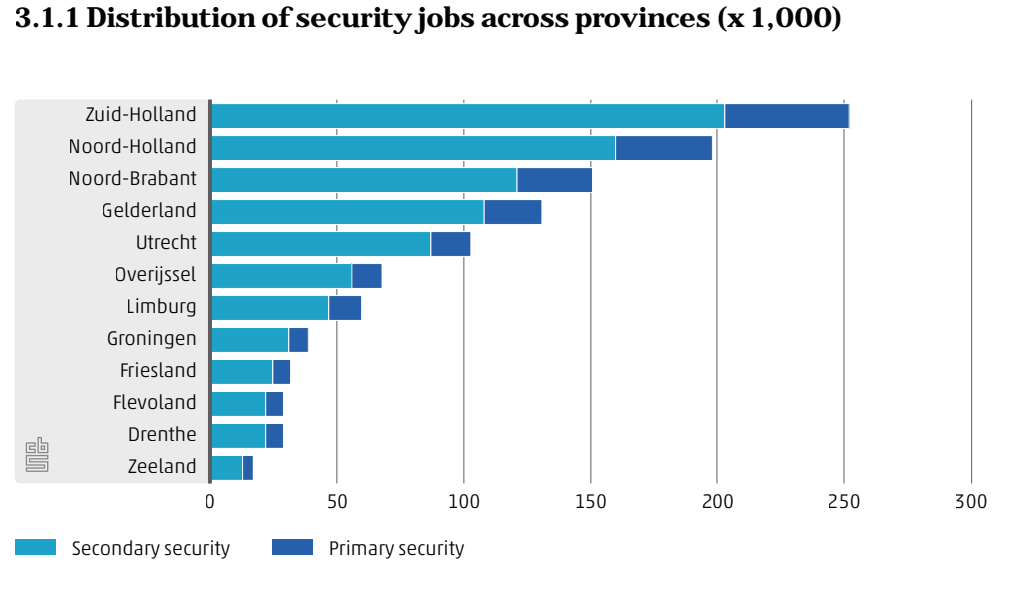
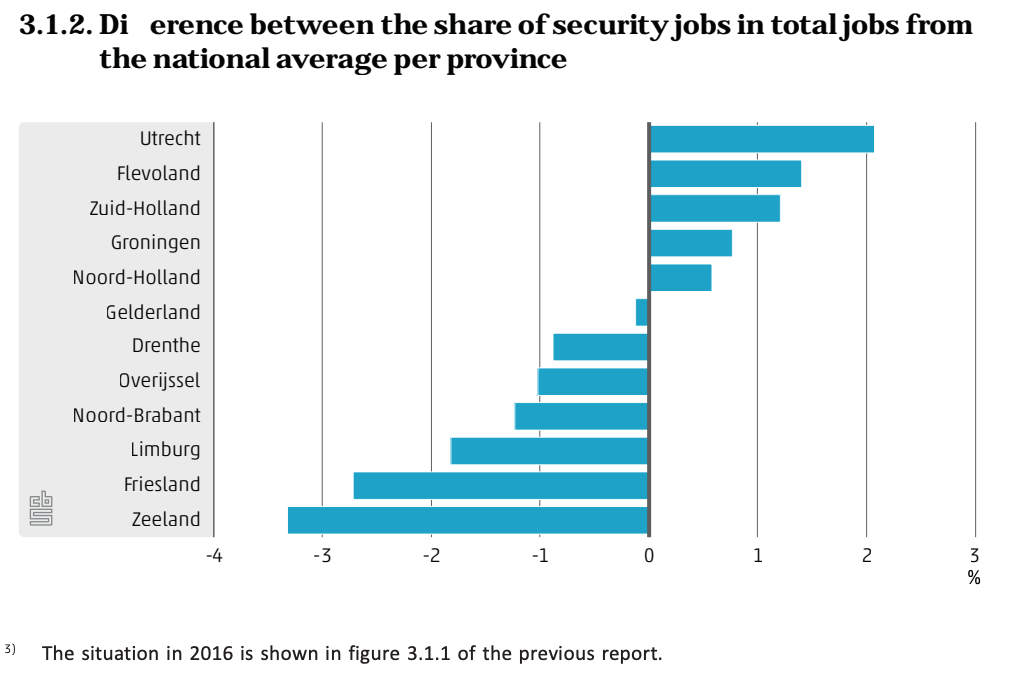
Zuid-Holland has the greatest number of security jobs, both in terms of primary and secondary security jobs. Generally, the distribution of security jobs mirrors the distribution of economic activity in the Netherlands, and this is illustrated in Figure 3.1.1. The provinces Zuid-Holland and Noord-Holland are economically large and populous, whereas this is less so for Drenthe and Zeeland. Figure 3.1.2 shows the provinces in which security jobs make up a larger or smaller share of the total jobs relative to the national average. The information in figure 3.1.2 complements that in figure 3.1.1. For example, we know from 3.1.1 that Zeeland is small in terms of the absolute number of security jobs. Figure 3.1.2 shows that Zeeland is also the smallest in terms of the share of these jobs in the total number of jobs in Zeeland. Another example is Utrecht. Although this province ranked fifth in terms of the absolute number of jobs (see figure 3.1.1), Utrecht had the largest share of security jobs of all provinces


